1. What is SmartArt?
2. When should you use SmartArt?
3. What are the types of Smart Art Graphics?
4. What are the various SmartArt styles?
SmartArt Graphics is a visual representation of data or information. It is quick and easy to make and jazzes up your presentation like nothing else. It not only enhances the visual appeal of your information but also helps communicate your idea better. SmartArt, however, is not a graph/chart wherein you input data and get a chart as your output.
Example
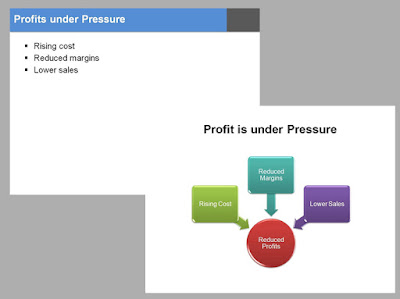
Profit in your business unit is under pressure. It has happened because of rising costs, reduced margins and lower sales. You can present it with bullets (as most people do) or by using SmartArt. The profit circle in red and the arrows depicting the cause and effect relationship help communicate your point better.

Do not use it for jazzing up unnecessary content. Use it to drive home a point better. To make it stick in the minds of the audience. You can also use it to make boring content interesting.
What SmartArt cannot do?
SmartArt will not generate charts from raw data.
What are the types of SmartArt Graphics?
SmartArt has the following types of graphics:
List - a list of itemsProcess - steps in a processCycle - a cyclical processHierarchy - an organization chartRelationship - cause & effectMatrix - parts and the wholePyramid - proportional or hierarchical relationship
In total there are 115 types of graphics you can choose from. Which SmartArt you use would depend on your need. Explore the various graphic types and you will find some jewels in the SmartArt gallery.
Getting started with SmartArt Graphics
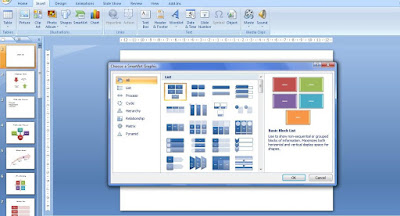
Go to 'Insert' -> SmartArt -> Choose your SmartArt type

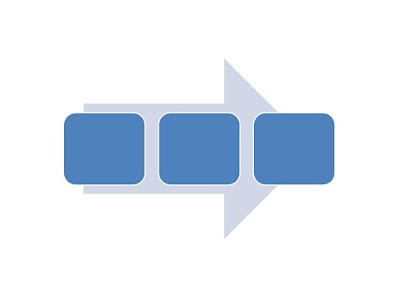
Let's say you choose 'Continuous Block Process' under 'Process'
Adding Shapes
There are 3 boxes to start with. You can add shapes by right clicking on a box and choosing 'add shapes after or before'
 Entering Text
Start typing your text in the boxes. You can change font type and size by selecting the entire SmartArt object and then changing font under the 'Home' tab.
Design Options
You can change colors and styles of your SmartArt Graphic under 'SmartArt Tools Designs Tab' which opens only when you are working on the SmartArt.
SmartArt Styles
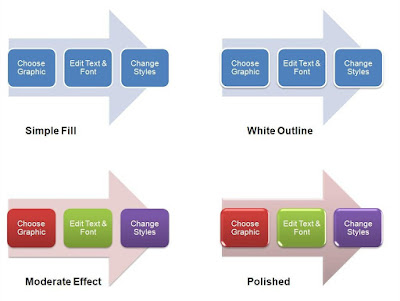
Instead of choosing 'simple fill' which comes by default try styles like white outline, moderate effect, intense effect and polished.

These are the basic things one should know in order to get started with SmartArt.
If you do not use SmartArt Graphics while making presentations I would like to know why. What is it that you dislike? Drop in a comment.
Smartart also makes it easy for people to add color and diagrammatic representations without too much thought. Sometimes it just results in a colorful bullet point slide. Have you seen this happen?
ReplyDeleteHow to Create a Strong Beginning????
ReplyDelete@virendra
ReplyDeleteThanks for so many questions virendra.
A strong beginning?
Well the most important thing at the beginning is to make the audience interested. Whether your audience will pay attention throughout your talk depends on the first few minutes. So focus on being relevant.
Answer this question at the beginning:
a) What are you going to talk about? (Agenda)
b) Why should the audience listen to you? (What is in it for them?)