14 Charting Tips: Tip #10 Coloring Your Chart
This is the 10th post in the series, 14 Tips to Present Awesome Charts.
 "Life is polychromatic. Do not live it in monochrome."
Your chart is a lot like your life. So, stop being a bore and make your charts interesting by coloring them well.
What is the role of color in a Chart?
While I am talking about chart colors, I can see many eyebrows raising. "We make formal presentations and all this coloring has no place in our company. Let's talk data."
This post is not about how to make your chart colorful and get noticed. This post is about how to balance the colors on a slide so that chart colors become invisible.
Yes, the way I look at colors is:
"Color is that ingredient of your dish (chart) which does not have a taste of its own. It enhances the taste of the dish without getting noticed. If the color of your chart is getting noticed, you have failed."
The role of color is thus two fold:
1. It has to make the job of audience easy to read the chart
2. It should not distract and draw attention towards itself
Example 1: Look at this chart from the website of Emami. A FMCG major which is also one of the most aggressive marketers in India.

This chart is a disaster. Too much clutter.
How many colors are there in a chart?
To color a chart you need to take care of many things. It is not only the color of the bar or line graph. You need to consider the following four:
1. Color of the bar/line graph
2. Color of the plot area
3. Color of the chart area, and
4. Color of the slide.
Look at the image below:

When I talk about chart color I am talking about the color of these 4 elements (slide, plot area, chart area and bar/line). The color of your bar cannot be seen in isolation from the colors around it.
When you create a chart you must ensure there is harmony and balance between color of these 4 elements. The question I would like you to think about is where do you start? Which color should you pick first?
It is the slide color which comes first. The order is SCPB (S-Slide, C-Chart, P-Plot, B/L-Bar/Line). It is the same order which they appear in the slide above. You do not decide the slide color after making your chart. The slide color (which is part of the template) is decided first. Charts come later. You might have a fixed template or you might like to use your corporate colors in your entire presentation. Like Arcelor Mittal's annual report where they have all backgrounds in orange and grey.
 Step 1: Choosing the slide background color
Whenever you make a presentation, go for a white background. If your presentation has a lot of charts, white is the best background for you. Even if your presentation does not have charts, white is still the best slide background color.
Example 2: A white background looks better

White is more comfortable on the eye and allows a lot more flexibility in choice of colors for the other elements of the chart. Black on the other hand is heavy on the eye.
Step 2: Choosing the colors of chart area & plot area
After having decided the slide background color, we now need to decide the colors of C, P and B/L. Use this rule always:

All I am saying is, merge the chart into the slide completely. So that there are only two parameters left to color. One the background (Slide=Chart area=Plot area) and second the Bar/Line graphs. You might choose a black background or a white background. But ensure that you merge S, C and P so that the chart is easy on the eye.
Step 3: Choosing the color of Bar/Line Graphs
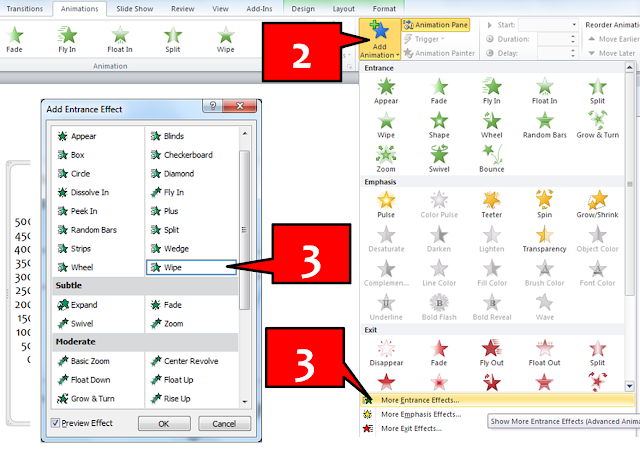
After merging the slide area with the chart area and the plot area now its the turn of the bar graphs/line graphs. MS PowerPoint gives you many options. It is a two stage process.
 First, choose from the 5 options on the left. To change the color of the bar select it by clicking on it and rigth click for 'Format Data Point'. You can now get all these types of options. Which one do you use normally? The default is always solid color.
I would advice you to do the following:
1. Always go for solid color bars
2. If you are plotting only one thing (sales over years) then all bars should be of the same solid color. If however, you are plotting 2 things (sales and profits over years) so there are 2 bars. Go for different color bars for sales & profits. You can also choose a shade of the same color (dark and light blue).
3. If you are plotting more than 2 things, then never choose shades of the same color.
Example 3: Hypothetical pie chart (inspired from a real life chart). Let us come out of bar graphs and see this pie chart which tries to show 7 things.
 If color is the ingredient of your recipe then this pie chart is a recipe for disaster. A simple solution for this is to use labels (Product M, N) besides the percentage. Making the chart multicolor will not solve this problem.
To Summarize, remember these guidelines while you use color:
1. The fewer the number of colors you use, the better your chart becomes.
2. Do not do anything that draws attention of your audience towards the color of the chart.
3. Stay away from gradients, flashy colors and using images in your bars. They reduce the visibility of your chart.
Keep watching presentations and observe how people use colors in charts. Remember, that you cannot ignore it!
Did I leave any doubt in your mind? or do you disagree to something? Leave a comment.
--
Disclaimer: Charts used above are purely for educational purposes. It is not meant to comment on the working of any organization. They would be removed in case anyone has any objection.
 "Life is polychromatic. Do not live it in monochrome."
Your chart is a lot like your life. So, stop being a bore and make your charts interesting by coloring them well.
What is the role of color in a Chart?
While I am talking about chart colors, I can see many eyebrows raising. "We make formal presentations and all this coloring has no place in our company. Let's talk data."
This post is not about how to make your chart colorful and get noticed. This post is about how to balance the colors on a slide so that chart colors become invisible.
Yes, the way I look at colors is:
"Color is that ingredient of your dish (chart) which does not have a taste of its own. It enhances the taste of the dish without getting noticed. If the color of your chart is getting noticed, you have failed."
The role of color is thus two fold:
1. It has to make the job of audience easy to read the chart
2. It should not distract and draw attention towards itself
Example 1: Look at this chart from the website of Emami. A FMCG major which is also one of the most aggressive marketers in India.

This chart is a disaster. Too much clutter.
How many colors are there in a chart?
To color a chart you need to take care of many things. It is not only the color of the bar or line graph. You need to consider the following four:
1. Color of the bar/line graph
2. Color of the plot area
3. Color of the chart area, and
4. Color of the slide.
Look at the image below:

When I talk about chart color I am talking about the color of these 4 elements (slide, plot area, chart area and bar/line). The color of your bar cannot be seen in isolation from the colors around it.
When you create a chart you must ensure there is harmony and balance between color of these 4 elements. The question I would like you to think about is where do you start? Which color should you pick first?
It is the slide color which comes first. The order is SCPB (S-Slide, C-Chart, P-Plot, B/L-Bar/Line). It is the same order which they appear in the slide above. You do not decide the slide color after making your chart. The slide color (which is part of the template) is decided first. Charts come later. You might have a fixed template or you might like to use your corporate colors in your entire presentation. Like Arcelor Mittal's annual report where they have all backgrounds in orange and grey.
 Step 1: Choosing the slide background color
Whenever you make a presentation, go for a white background. If your presentation has a lot of charts, white is the best background for you. Even if your presentation does not have charts, white is still the best slide background color.
Example 2: A white background looks better

White is more comfortable on the eye and allows a lot more flexibility in choice of colors for the other elements of the chart. Black on the other hand is heavy on the eye.
Step 2: Choosing the colors of chart area & plot area
After having decided the slide background color, we now need to decide the colors of C, P and B/L. Use this rule always:

All I am saying is, merge the chart into the slide completely. So that there are only two parameters left to color. One the background (Slide=Chart area=Plot area) and second the Bar/Line graphs. You might choose a black background or a white background. But ensure that you merge S, C and P so that the chart is easy on the eye.
Step 3: Choosing the color of Bar/Line Graphs
After merging the slide area with the chart area and the plot area now its the turn of the bar graphs/line graphs. MS PowerPoint gives you many options. It is a two stage process.
 First, choose from the 5 options on the left. To change the color of the bar select it by clicking on it and rigth click for 'Format Data Point'. You can now get all these types of options. Which one do you use normally? The default is always solid color.
I would advice you to do the following:
1. Always go for solid color bars
2. If you are plotting only one thing (sales over years) then all bars should be of the same solid color. If however, you are plotting 2 things (sales and profits over years) so there are 2 bars. Go for different color bars for sales & profits. You can also choose a shade of the same color (dark and light blue).
3. If you are plotting more than 2 things, then never choose shades of the same color.
Example 3: Hypothetical pie chart (inspired from a real life chart). Let us come out of bar graphs and see this pie chart which tries to show 7 things.
 If color is the ingredient of your recipe then this pie chart is a recipe for disaster. A simple solution for this is to use labels (Product M, N) besides the percentage. Making the chart multicolor will not solve this problem.
To Summarize, remember these guidelines while you use color:
1. The fewer the number of colors you use, the better your chart becomes.
2. Do not do anything that draws attention of your audience towards the color of the chart.
3. Stay away from gradients, flashy colors and using images in your bars. They reduce the visibility of your chart.
Keep watching presentations and observe how people use colors in charts. Remember, that you cannot ignore it!
Did I leave any doubt in your mind? or do you disagree to something? Leave a comment.
--
Disclaimer: Charts used above are purely for educational purposes. It is not meant to comment on the working of any organization. They would be removed in case anyone has any objection.


Comments
Post a Comment