Understanding File Formats
JPG or JPEG - This file format is best for real life photographs. Also preferred when an image has a lot of gradient. JPG is not good for line drawings and text.
GIF - GIF is only suitable for text, small icons, cartoons (with minimal amount of colour). GIF distorts the colours present in the image.
PNG - PNG as a format came into being as an improvement over GIF. GIF is suitable for text and line drawings but distorts even a small amount of colour. PNG overcomes this problem. You can use PNG for text and line drawings (with or without colours). PNG is better than GIF all the time. It can handle colour very well.
BMP - BMP is a very bulky format. The quality of your image will be good but the size will be too big. Refer to the example we saw in the last post. A simple pie chart's image in BMP was 3.63 MB whereas it was 57 KB in PNG. Avoid BMP at all costs.
We have now ruled out BMP from any further analysis. We are now only left with JPEG, GIF and PNG.
Applications & Examples
If you are taking a screen shot of a web page and the web page contains text, use GIF or PNG. If it contains only images, use JPG. If it contains both, use PNG. Even if there is a small amount of colour on the slide, GIF will not do a good job.
Hence, you can also avoid GIF at all times. Because PNG can do what GIF can do and more. If there is only text on a screen PNG will still work well.
 The table above should clear all your doubts. If you are taking a screen shot this table will help you choose the file format in which you should save the image.
Steps in Reducing File Size of an Image in MS PowerPoint
If you are trying to reduce file size by copying the image and pasting in a different file format, the same rule applies. If your photograph is in BMP and you want to reduce its file size. You can copy it and paste special as .JPG.
Step-1: Insert image on the slide
Step-2: Copy the image (Ctrl+C)
Step-3: Delete the image
Step-4: Paste Special As... (Keyboard shortcut: Alt+E+S+V)
It will give you options of various file formats and you can choose the one you desire.
Understanding Transparency
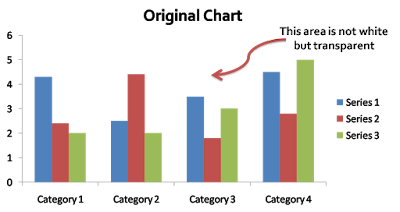
When you create a chart in MS PowerPoint, the chart area and plot area are not white but transparent. If you save a chart as a picture (in PNG) and use it in a presentation the chart will look differently in different backgrounds.
Here is a chart you have created in MS PowerPoint.

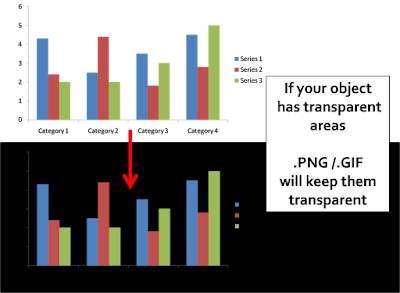
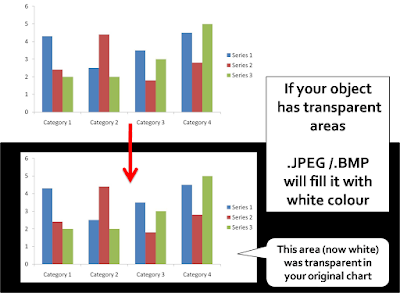
If your original object has transparent areas, then saving the object in PNG and GIF will keep those areas transparent. If you save in JPEG or BMP then those transparent areas will get filled with white colour.

In the image above, you can see that saving the chart as .PNG or .GIF keeps the transparency. So if you want to use the chart on a black background, you have to either save it as .JPEG or colour the chart and plot area of the chart with white colour.

In this image, you see that saving the chart as a .JPG or .BMP image will make the transparent areas white.
These posts would have made you realize why you need to know about these file formats and how to use them to your maximum advantage.
Resources: Some useful sites I have referred to while creating this content. Tips4pc, Labnol, Bluewave, Sitepoint.
No comments :
Post a Comment