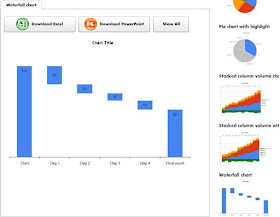
Juice Analytics: Charts Chooser
This is a website which helps you in multiple ways:
1. It helps you decide on what kind of chart you should use. You might wish to present a comparison or a distribution. It might be a relationship between variables of just a simple trend. The categories on which Juice Analytics has charts are:
- Comparison
- Distribution
- Compositor
- Trend
- Relationship
- Table
2. Once you decide on a chart type Juice Analytics provides you a ready made excel sheet. You can download the excel sheet which lets you feed in your data and generate the chart automatically. This feature is especially helpful when you don't want to waste time creating a chart. Or you don't know how to create one. Eg. You might want to use a waterfall chart but you don't know how to create one. With Juice Analytics, you can simply download the excel, feed in your data and copy the graph to your PowerPoint.
 In total there are 17 chart types available. Try it out the next time you want to save time creating a chart. In case you know of more such links do share them with me.
No comments:
Post a Comment