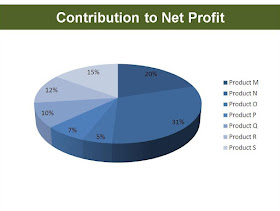
Look at these two charts which I happened to see in the recent past. I have kept the chart similar to the original one I saw but I have changed the context for reasons of confidentiality. Chart 1 is trying to depict how sales of 9 products have moved over the past six months.

What is wrong with these Charts?
Chart 1 is full of clutter. It has no values mentioned anywhere and it is very confusing. More than all this, one cannot even figure out which line denotes which product. An Orange is very similar to a Brown when seen from a distance.
Chart 2 is also asking too much of the audience. What aesthetic value does one derive in presenting a chart like this? Why should I get confused when I want to know what percentage of profits come from Product P?
After I see these kinds of charts only two things come to my mind.
One, that the presenter has not spent enough time wondering how people will comprehend the information. And Two, whether the presenter is at all interested in clarity. Many a times, people do want to conceal and confuse. In which case, these kind of charts serve the purpose well.
The point I am trying to make from these charts is that, you are close to the data and you are well versed with what you are presenting. But think for a moment about the audience who will see this data for the first time. How will you make them understand?
I want to leave you with a small task. Spend a minute each and modify these charts to make them more user-friendly. What changes would you make to these charts so that any person seeing it for the first time can easily comprehend the information without taking much time?
What elements should a 'good chart' have?

No comments:
Post a Comment