 We are now almost at the end of this 14 part series. In the last post I talked about an often neglected part of presenting charts; colors. Today, we will discuss about another area which presenters have underutilized; Chart Animations.
We will discuss the following:
1. What do we mean by chart animation?
2. When to use animation and why?
3. How to animate a chart?
4. How not to misuse animation?
1. What do we mean by chart animation?
When we talk of chart animation, we do not mean that the entire chart appears with an effect or fades in, etc. We are talking of animating the line graphs or bar graphs of the chart. Animation would make each data point or series of data points come one after the another, with a clear purpose. The purpose is covered in point 2.
2. When to use animation and why?
In my Feb 24th post this year, I had talked about when to use animation. That applies to any animation and hence I would quote what I had said:
"Animation is a powerful tool. It brings your presentation to life. When slides after slides are static, animation comes in to break the monotony. It draws the attention of the audience and gets your point across very effectively. You should use animation when:
1. You want to draw the audience attention to an important point
2. You want to explain a complicated process
3. You want to share information in a phased manner"
Point 1 and 3 are applicable when we are animating a chart. There is also a 4th instance:
4. When you have too much information to present in a chart, it is better to animate and present in a sequence.
As I have mentioned, the reason you use animation is that it breaks the monotony. Imagine after 10 static slides you suddenly have a good animation on Slide 11. Audience attention increases many fold.
As I have mentioned, the reason you use animation is that it breaks the monotony. Imagine after 10 static slides you suddenly have a good animation on Slide 11. Audience attention increases many fold.
3. How to animate a chart?
We would look at various examples and learn how to animate.
Example 1 (Illustrating Point 1 above):
You, the CEO of Red Soaps, is presenting at a press conference ahead of your IPO (new share issue to public). Because your soap brand (Red No. 1) is not advertised it is not popular in the masses. Your charts' key message is that your brand is much bigger than the 4 more popular soap brands in the market. How do you draw the attention of the public who are going to give you $1000mn if your presentation impresses them? Well, if you use the easy-to-use framework in my 2nd post, you would choose a bar graph. Here is your chart:
You, the CEO of Red Soaps, is presenting at a press conference ahead of your IPO (new share issue to public). Because your soap brand (Red No. 1) is not advertised it is not popular in the masses. Your charts' key message is that your brand is much bigger than the 4 more popular soap brands in the market. How do you draw the attention of the public who are going to give you $1000mn if your presentation impresses them? Well, if you use the easy-to-use framework in my 2nd post, you would choose a bar graph. Here is your chart:

You can present this chart at once and make the point; "You know these big brands. But did you know we are bigger than them?"
A better approach: Create a story. Animate the five bar graphs (animation effect: wipe from bottom) and ask the audience to guess the turnover of each brand. At the last, when your brand's bar goes past all these popular brands, your audience will get the message loud and clear. They will remember this animation and will also remember the message.
A better approach: Create a story. Animate the five bar graphs (animation effect: wipe from bottom) and ask the audience to guess the turnover of each brand. At the last, when your brand's bar goes past all these popular brands, your audience will get the message loud and clear. They will remember this animation and will also remember the message.

Step 1: Right click on your chart -> Edit Data -> Arrange the series in ascending order of sales.
Step 2: Click on the chart to select it -> Animations Tab (in version 2007) -> Custom Animation -> Add Effect -> Entrance -> Wipe
Step 3: In Custom Animation -> Make Direction from Bottom -> Speed Fast -> Start On Click
Step 4: Drop down menu -> Effect Options -> Chart Animation Tab -> Group Chart By Category -> Do not Start animation by drawing the background

In slide show mode, the axes and title would be present. Your bar graphs will come one by one mouse click.
Example 2 (Illustrating Point 3 above):
You are presenting the shareholding pattern of Infosys. You want to talk about each of the 6 entities which own shares in the company. You plan to spend a minute each on every group of investor. You thus want to show this information in a phased manner.

If you put up the entire pie at one go, then every member of the audience is free to look at any component. You lose control. To take the entire audience along and have all of them paying attention to what you want them to listen, you need to animate this chart. Animate it to present one portion at a time.
Animation Steps
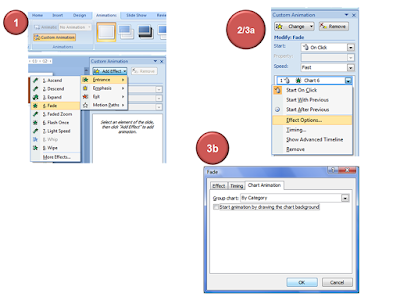
Step 1: Select the chart -> Animations Tab -> Custom Animation -> Add Effect -> Fade
Step 2: In Custom Animation -> Speed Fast -> Start On Click
Step 3: Drop down menu -> Effect Options -> Chart Animation Tab -> Group Chart By Category -> Do not Start animation by drawing the background
Now in slide show mode, your chart will come like this:

Example 3 (Illustrating Point 4):
When you have too much information to present in a chart and together it looks cluttered, you should animate and present them one at a time. Imaging you are tracking the share prices of various Pharma companies from Jan to May '09. This is how the chart looks like:

You are presenting the shareholding pattern of Infosys. You want to talk about each of the 6 entities which own shares in the company. You plan to spend a minute each on every group of investor. You thus want to show this information in a phased manner.

If you put up the entire pie at one go, then every member of the audience is free to look at any component. You lose control. To take the entire audience along and have all of them paying attention to what you want them to listen, you need to animate this chart. Animate it to present one portion at a time.
Animation Steps
Step 1: Select the chart -> Animations Tab -> Custom Animation -> Add Effect -> Fade
Step 2: In Custom Animation -> Speed Fast -> Start On Click
Step 3: Drop down menu -> Effect Options -> Chart Animation Tab -> Group Chart By Category -> Do not Start animation by drawing the background

Now in slide show mode, your chart will come like this:

Example 3 (Illustrating Point 4):
When you have too much information to present in a chart and together it looks cluttered, you should animate and present them one at a time. Imaging you are tracking the share prices of various Pharma companies from Jan to May '09. This is how the chart looks like:

I have just shown 3, you might have 5 or 10! Instead of putting all of them and making a mess present each line graph one by one. So at the first click, line 1 comes as 'wipe left' and you can talk about it. Then line 2 can come (you can make line 1 disappear as well or keep it). This way you can present the same information in a much more understandable manner. The method to animate these lines is the same as already described above.
4. How to not misuse animation?
Animation is a 'special' effect which works when used very few times. Then only it breaks the monotony and draws audience attention. Do not do the following:
i. Do not animate every possible chart in your presentation
ii. Do not use wrong effects (line graph coming as 'wipe from bottom', horizontal bar coming as 'wipe from left')
iii. Do not use weird effects. Use simple effects like fade, zoom, wipe, ascend, descend, expand, compress, etc.
iv. Do not use more than 1 type of effect in a chart. Every sub-part of pie should come as fade in. Do not make one part zoom in, another zoom out and the third fade.
If used prudently, animation can become the secret weapon that will give your presentation an undue advantage over others.
No comments :
Post a Comment