What percentage of Indians are B+? (Can you visualise this?)
A colleague at my office was compiling our blood group data for HR purposes. This led my team to stumble upon an interesting piece of data on Wikipedia.
Do you know what percentage of people in the world belong to which blood group? We figured out that O+ is the most popular blood group in India (and in most other countries). One out of every 3 Indian is O+ and so is 4 out of every 10 US citizen. Only 8.5% of US citizens were B+ whereas a whopping 30.9% of Indians were B+. Here is a sample data I picked from Wikipedia. (These numbers are percentages which add upto 100. So 36.5% Indians are O+ and 22.1% are A+)
 How would you visualise this data? If you have to present this data how will you do that in a manner which provides most meaningful information?

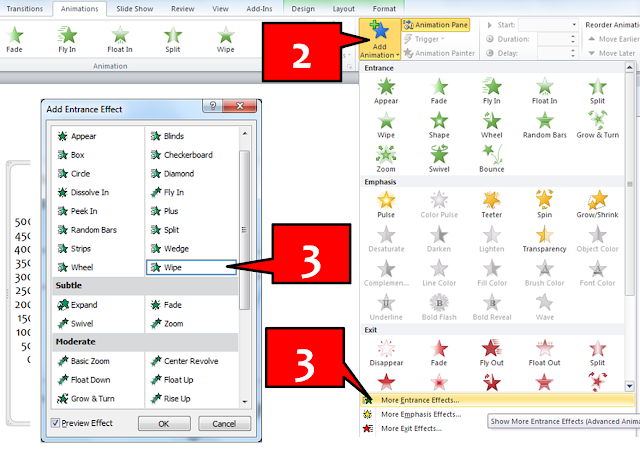

As a multi-line bar chart. Put the Percentage on the verticla axis and the countries on the horizontal axis. The plot multiple bars representing the blood group on each country. This will show that sure the O group is the highet for each country but will also quickly so closely competing group in each country - the B group being that for India in your example.
ReplyDeleteNo Idea what happened to the grammar and all those typos in my above post - Here is the corrected version:
ReplyDeleteDepict it as a multi-line bar chart. Put the Percentage on the vertical axis and the countries on the horizontal axis. Then plot multiple bars representing the blood group on each country. This will show that sure the O group is the highest for each country but will also quickly show closely competing group in each country - the B group being that for India in your example.
Thanks Google
ReplyDelete