How to animate line charts? - A twist
On a very old post of mine came a comment few days back. Though the reader did not give his/her name, the question was interesting.
The post was about animating line charts, so the lines come one after the other. For example, see the chart below.

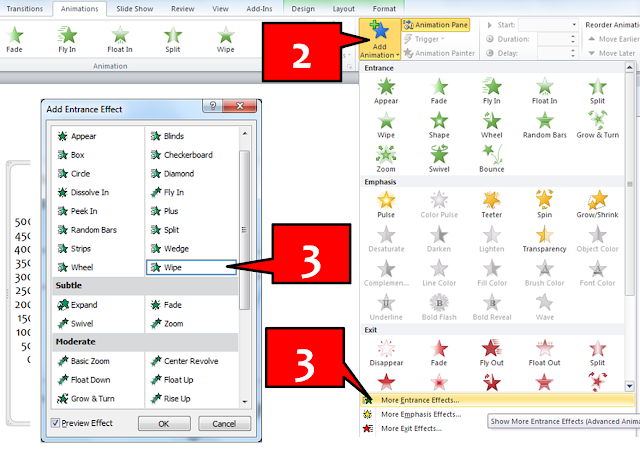
If you want to show Series 1 first and hide Series 2 and 3, you can do so by animating the chart. In brief, the process is as follows: Click on the chart to select it -> Choose animation (wipe from left) -> Go to animation pane (on your right) -> Under Chart Animation -> Group Chart 'By Series'. Done!
For more detailed directions click here.
The comment which came on this post was: "How does one change the order of animation?" In the method described above first Series 1 comes, then 2 and then 3. How does one get Series 3 before 2?
The answer: MS PowerPoint does not allow us to reorder the series. There is however a hack to this. I will present 3 solutions. To repeat the question again... We have series 1, 2 and 3 and we need the animation to be in the order of 1, 3 and 2. When we click series 1 comes, then 3 and then 2.

Solution 1
The answer which was posted by the reader himself/herself is as under:
Cut the table (CTRL+X)
Paste Special as 'Picture (Enhanced Metafile)'
Right click -> Group -> Un-group
Un-group again
Now all the elements of the graphs have been un-grouped.
Choose Series 1, 2 and 3 and animate them.
We can now reorder these separate animation under the animation pane.
The source of this method as shared by the reader is this.
Quick Tip: How to do Paste Special?
Copy an object -> Under Home Tab (on your extreme left) -> Paste -> Paste Special. Shortcut: Alt + E + S + V (in 2007)
Solution 2
The chart has a base excel file. If you right click on the chart and choose 'edit data' you will arrive at the excel file from which the chart has been made.
Go to the excel file and rearrange the columns. Put Series 1 in column 1, Series 3 in column 2 and Series 2 in column 3.
Having rearranged the columns, you now have to use the same old animation technique. Click on the chart and choose animation. By default now, the animation order will become Series 1, 3 and 2.

This is the base file in which we will change the order of the series. Insert a column after Series 1. Copy data from Series 3. Delete Series 3 (Column E). Then rename Column C as Series 3. That's it. We are done!
Thanks 'Anonymous' for asking the question and providing the answer too. Solution 2 looks easier if we know in which order we want to present our charts.
The post was about animating line charts, so the lines come one after the other. For example, see the chart below.

If you want to show Series 1 first and hide Series 2 and 3, you can do so by animating the chart. In brief, the process is as follows: Click on the chart to select it -> Choose animation (wipe from left) -> Go to animation pane (on your right) -> Under Chart Animation -> Group Chart 'By Series'. Done!
For more detailed directions click here.
The comment which came on this post was: "How does one change the order of animation?" In the method described above first Series 1 comes, then 2 and then 3. How does one get Series 3 before 2?
The answer: MS PowerPoint does not allow us to reorder the series. There is however a hack to this. I will present 3 solutions. To repeat the question again... We have series 1, 2 and 3 and we need the animation to be in the order of 1, 3 and 2. When we click series 1 comes, then 3 and then 2.

Solution 1
The answer which was posted by the reader himself/herself is as under:
Cut the table (CTRL+X)
Paste Special as 'Picture (Enhanced Metafile)'
Right click -> Group -> Un-group
Un-group again
Now all the elements of the graphs have been un-grouped.
Choose Series 1, 2 and 3 and animate them.
We can now reorder these separate animation under the animation pane.
The source of this method as shared by the reader is this.
Quick Tip: How to do Paste Special?
Copy an object -> Under Home Tab (on your extreme left) -> Paste -> Paste Special. Shortcut: Alt + E + S + V (in 2007)
Solution 2
The chart has a base excel file. If you right click on the chart and choose 'edit data' you will arrive at the excel file from which the chart has been made.
Go to the excel file and rearrange the columns. Put Series 1 in column 1, Series 3 in column 2 and Series 2 in column 3.
Having rearranged the columns, you now have to use the same old animation technique. Click on the chart and choose animation. By default now, the animation order will become Series 1, 3 and 2.

This is the base file in which we will change the order of the series. Insert a column after Series 1. Copy data from Series 3. Delete Series 3 (Column E). Then rename Column C as Series 3. That's it. We are done!
Thanks 'Anonymous' for asking the question and providing the answer too. Solution 2 looks easier if we know in which order we want to present our charts.


Is it possible to have line 1 in the chart appear, then DISAPPEAR before Line 2 appears? And have line 2 DISAPPEAR before Line 3 appears, and so on? I can't seem to find the answer to this....most of what I'm finding is how to animate lines (appear only). thanks for any help.
ReplyDeleteKaren
Hi Karen
ReplyDeleteIt is very much possible to do this.
Step-1 Cut the table (CTRL+X)
Step-2 Paste Special as 'Picture (Enhanced Metafile)'
Step-3 Right click -> Group -> Un-group
Step-4 Un-group again
Now all the elements of the graphs have been un-grouped. Click and choose Series 1, 2 and 3 and animate them.
Click on Series 1 and animate it again. In MS PowerPoint 2010, you can choose 'Add Animation' -> Exit -> Choose Fade or whatever else you want.
In the Animation pane, move the Exit animation and place it after Series 1 entry animation. Keep all these animation 'on click'. That's it.
If you need a more detailed explanation, do let me know.
I tried your first solution, but I'm in PPT 2012 on a Mac. I'm not seeing a Picture that is Meta. I tried picture, but seems to compress it like a jpeg. The individual parts disappear. Help I need to finish this project by tomorrow. So frustrating that in Animation it doesn't allow you to separate and animate one line by series and one by category. Err.
ReplyDeleteI didn't ask my first question well. What I want to accomplish is a little different. I want one of the series lines to draw and then when the lines cross at a category I want them to pause then continue on click. Is that possible? again I am using 2012 ppt on a Mac.
ReplyDelete@Desi McKinnon
ReplyDeleteLet me rephrase your question. You want to animate one line chart. Then on a click, the second line will appear. But it will come to the point where they intersect. Stop. Then move on on click.
It is not possible in PowerPoint. However, there is a way of doing it using shapes and animation. I am giving a quick explanation. Let me know if you need a more detailed solution.
Draw a line (Insert shapes - Line) on top of the second line graph upto the point where you they intersect. Animate it. Now draw a separate line which starts from the intersection and moves on.
Animate it as well.
Now change the colour of the second line (the actual original line graph) to white (assuming the background is white). So you will not be able to see it. You are done!
@Desi McKinnon
ReplyDeleteEasier may be to make two series out of the one you want to pause. The first one goes from the start to the intersection, the second from the intersection to the end. Format them identically and delete one of the from the legend (if you have one) and animate as usual (by series).