Sep 26, 2009

Free E-Book: 14 Tips to Present Awesome Charts

I have published an e-book, '14 Tips to Present Awesome Charts'. It is based on the recently concluded series on the blog where I shared 14 practical tips with you on how to make effective and smarter looking charts. Based on real life charts taken from some of the well known companies in India and abroad this e-book takes you through each tip in a simple and easy manner. It is a concise version of the 14 blog posts (which were pretty elaborate).

Download the e-book by clicking here.

If you have any problems downloading it, email me and I will mail you the file. My email id: vivek [at] jazzfactory [dot] in.


Feel free to share it with your friends and colleagues. Read it, share it and tell me how did you like it. I would appreciate your comments and feedback.

Sep 19, 2009

Recap of 14 Tips to Present Awesome Charts

14 Tips to Present Awesome Charts is a special series which shares 14 practical tips on how to present your charts better.
Why study the 14 Tips?
You can crunch data well and make a chart. At the time of presenting you still falter because you have overlooked the bigger picture (why are you presenting the chart? what is your key message?). Your chart looks complicated and busy because you have allocated no time to chart design. To understand what goes behind making a great chart, read these tips. Every tip contains multiple examples from real life. Here are the links to the 14 posts:

1. Why do you need a chart?
You should not work with the principle that 'where there is raw data there is a chart'. This post helps you find out when you need a chart and when you don't.

2. How to choose the right chart type?

Most of the time you have multiple chart types to choose from. Line or bar, bar or pie. This post deep dives on how to choose a right chart type with an easy to use framework. A must read post!

3. Chart Title

Talks about the purpose of a title and how to write the perfect chart title.

4. Key Message
The reason you are presenting a chart is to prove a point. Your key message then becomes the most important element of your chart. This post explains how to present the key message.


5. Data Points

In order to prove your point, you don't need to create a chart with every piece of raw data available. This post provides tips on how to decide on the number of data points and the cautions you need to take to present them.


6. Data Labels

If you are wondering why am I talking about data labels, this post is for you. Often ignored aspect of a chart is data label. Find out how and when to label your data points and more.


7. Legend

If data label is the most ignored element of a chart, legend is the most abused. This post will tell you everything you need to know about legends; its need, its position and its usage.


8. Chart Axis

Enhance the understanding of your chart by mastering chart axis. This post also contains a step by step guide on when and how to use secondary axis.


9. Source of Data

Add a booster dose of credibility to your chart by mentioning the source. Learn about when a source is needed and how to write one.


10. Chart Colors

Stop being a bore and understand the importance of colors in your chart. No, I do not encourage you to fill your charts with every possible color. Discover how you can really enhance audience understanding by a right use of colors.


11. Chart Animation

The secret weapon with which you can draw complete audience attention and drive home your point with style and ease. This post tells you when to use animation and how.


12. Highlighting

Not everything in your chart is important. Understand what to highlight, when to highlight and how.


13. Chart Aesthetics

Enhance the aesthetic appeal of your chart in 10 easy steps. A must read post!


14. Summary

This series is based on the philosophy that presenting a chart involves learning about two things;
chart core and chart design. This post captures the essence of the entire series and gives you the bigger picture of how to present charts. It also contains tips on how to keep developing your charting skills.

Go ahead and use the series. Feel free to agree / disagree with what has been said. Apply the tips in real life and share the results. Share these tips with friends and colleagues.

I am in the process of creating a free e-book on these 14 tips. Watch this space for more.

Sep 16, 2009

14 Charting Tips: Tip #14 What next? A trip to Quito?

This is the final post in the series, 14 Tips to Present Awesome Charts.
In the last two weeks you have learned 13 tips on how to make your charts awesome. How to make charts that will help you achieve your overall presentation objectives. Should I expect that you will remember all the 13 tips and apply them every time you make a chart?

In my dreams.

How about a mnemonic?
Behold the 13 letters in order of their posts; N, T, T, K, D, L, L, A, S, C, A, H, A.

I am out of here!

So, what do you do with the 13 Tips?

After reading the 13 tips, you now need to understand the bigger picture; the process of making a good chart. You also need to know which ones are crucial and which ones can be taken lightly.

The Bigger Picture

Get out of the 13 tips and take a few steps back. Even better, take an airplane and rise above the crowd. What do you see?

This is the bigger picture. The process which you follow while making a good chart. This is a 4 step process:

Step 1. What is your key message?
Step 2: Is chart a right medium to express it? If yes, go to step 3.
Step 3: Which type of chart should you use?
Step 4: How should your chart look and feel? How is your chart designed?

The process starts with the point you are trying to prove. The role of design is to present the key message is a manner most understandable and palatable to the audience.

We have thus shrunk the 13 tips into 4 broad areas. Remember these four in this order: Key message, need for a chart, chart type and chart design.

Your Trip to Quito

Where do most people live in the world? On the equator, above it or below? The answer is above the equator (India, China, US all are above zero degrees latitude). How about the world of charts? In this world 90% people live at the extremes (north and south pole).

North Pole Presenters: They worry only about the 'Chart Core'. These people spend more time on the first three areas of making a chart: key message, need for a chart and chart type. They totally neglect chart design. This neglect comes from ignorance as well as lack of care.

South Pole Presenters: These guys get lost in small details and forget the overall picture. They spend more time on chart design. Trying hundred kinds of line colors, markers, shadows, gradient. You can throw them off balance if you ask, "What is the point you are making?" Amidst all this design they forgot the message.

What is the best place to be in this world of charts? Before we figure that out, I want to ask you where do you find yourself and where do you want to be? Think about it for a while. Do you really bother about chart design or you are too engrossed in it and spend disproportionate time designing your chart?

Quito, the dream destination

Quito is the best place to be in the world of charts. Have you heard of Quito? It is the capital city of Ecuador and it is the only major city which lies on equator. The word Ecuador itself means equator in Spanish. You see the small black dot on the east coast of South America. That's where Quito is.

Quito, bang on the equator, is the place to be for all of us. While making charts, the chart core (key message,
chart need and chart type) is as important as chart design. Give them equal importance and spend equal time on both the aspects. A balance between both these poles will result in an awesome chart. A few degrees here or there is just not good enough.

What does it take to go to Quito?

Quito is far for most people. The journey is long and treacherous. You need a lot of determination to get there. You also need to make a road map which will systematically take you to Quito. Here are some cues which will help you reach there:

1. Extra Effort: The next time you are going to make a chart, spend some extra time thinking about the four areas (key message, chart need, chart type and chart design).

2. Develop Basic Charting Skills: Develop your basics through practice. Know how to play with excel charts. If you get stuck refrain from calling your colleague. Solve it with help from your inbuilt software and from Google search.

3. Learn from Others: Download and watch investor presentations of large multinational companies from their website. Visit slideshare and check out the most voted presentations in your area of interest. Every time you see a chart, stop and ask why do you like or hate it?

Seek help and feedback from others. After a presentation, you can always ask your colleagues on how they liked the charts. Were they able to understand it easily or was something missing? People will always share candidly. You just need to ask.

4. Take Interest and Discuss: Follow a presentation blog like All About Presentations which writes about charts regularly. Start a conversation to try and understand what is being said and why.


Best of luck on your journey to Quito. Be rest assured that that you are not alone. You will always find a co-traveler in me. A
sk your friends and colleagues to also join in the fun.

Sep 15, 2009

14 Charting Tips: Tip #13 Chart Aesthetics

This is the 13th post in the series, 14 Tips to Present Awesome Charts.

What is chart aesthetics?

Aesthetics mainly deals with beauty and taste. In our context, chart aesthetics would mean the overall look and feel of a chart. For an audience to understand and read a chart, they need to like it first. It does not mean that a chart has to be a piece of art. It simply means the chart has to 'fit' in the slide and should not look out of place. It has to be such that your audience can easily read and remember the chart.

Why bother about chart aesthetics?

After all you are a serious presenter. It is a presentation in your college or office. And here I am teaching you aesthetics. So why should you bother? Let me show you four formal charts. Assume that you made these four charts. Would you be happy with this?
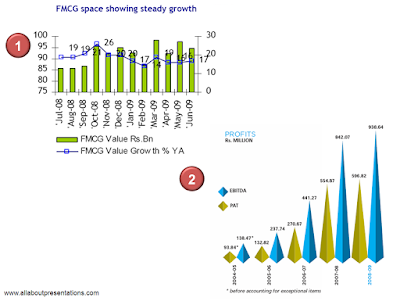
Chart #1: Do you think your audience would like to read this chart?
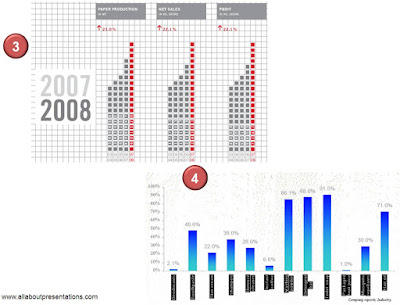
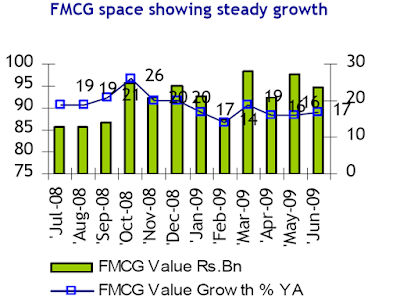
Chart #2:
Do you think your audience will be able to easily read the chart (and understand)?

Chart #3: Will you ever be able to prove your point when you present a chart like this? If you cannot, how will you meet your overall presentation objective?

Chart #4:
Do you think people would even like to read such a chart? What will they think about you after you have presented this chart?

Well as far as the charts go, they are from annual reports and presentations of FMCG major Dabur, Info Media Pvt Ltd (promoters of Naukri.com), BILT (makers of Matrix Office Stationery) and another FMCG major Emami respectively. You are human and hence you will make bad charts many a times. This is why you need to understand chart aesthetics.

How to enhance the appeal of your chart in 10 easy steps?

Aesthetics is a vast subject and leaving it at a theoretical level will not be good. Here is a technique you can use to dramatically enhance the aesthetic appeal of your chart in 60 seconds.

Technique: After you have made your chart, go through these 10 steps (in any order). Follow all the steps and within 60 seconds you will have a dramatically improved chart.

Step 1: Remove all the grid lines (major and minor).

Step 2: Adjust the size of your chart to balance it with other elements on the slide.

Step 3: Check for the font size and font color of axis, chart title and data labels. If you have re-sized your chart, you must re-adjust the font size.

Step 4: Maintain good contrast between colors of the slide, chart area, plot area and the bars/lines (more on it here). Aim for better visibility.

Step 5: Make the line graph thicker to enhance visibility and appeal.

Step 6: Change the location of your legend. This will free a lot of space (more on it here).

Step 7: Delete some data labels which you don't need, without causing a loss of information. This reduces a lot of clutter (more on this here)

Step 8: Club your axis title with your chart title. Instead of writing In '000 tons above y-axis you can always make the title as; Sales (in '000 tons). This will free some more (valuable) real estate. More on this here.

Step 9: Make the axis lines thicker. This gives a good frame of reference to the eyes to view the chart.

Step 10: Convert your three dimensional chart to a two dimensional one (3D to 2D). Why? Because the extra 'D' spells disaster.

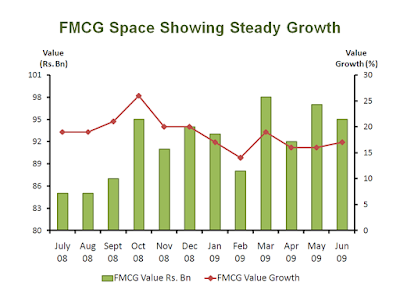
Let us use these 10 steps on the 1st chart. Here is the chart once again for your reference:

Chart Makeover Steps

Step 1: Skip. The chart does not have any grid lines.

Step 2: Skip. Not applicable, as we are dealing with the chart in isolation here.

Step 3: The font sizes are bigger than needed. Reduce them to something better.

Step 4: Color scheme

Bar Colors - Change the color of bar outline from black to dark green. So many bars with black outlines makes the chart look cluttered.

Line Colors - I have converted the line to reddish brown (as it gives better contrast). Right click on line graph -> Format Data Series -> Line Color

Step 5: Make the line graph thicker. Right Click -> Format Data Series and choose width 3. Also change the markers to diamond. Format Data Series -> Marker Options -> Built in (diamond) size 8 -> Marker Fill automatic.

Step 6: Legend on the bottom is fine. Having it on top will clutter the chart and having it on sides will narrow down the plot area.

Step 7: Remove all the data labels. When your bar graph does not have labels, why do you want to label the line graph? You key message is that FMCG industry is growing steadily. The trend is important and not individual values.

Step 8: There are no axis titles in the original chart. You should add axis titles because there are two axis and you have removed the labels for line graph. You must add axis titles
(Value Rs. Bn and Value Growth) to make the chart easy to read.

Step 9: Make the axis thicker. By default they are always thin. Right click on axis -> Format Axis -> Line Color Black -> Line Style -> Width 3.5

Step 10: Skip. This graph is two dimensional.

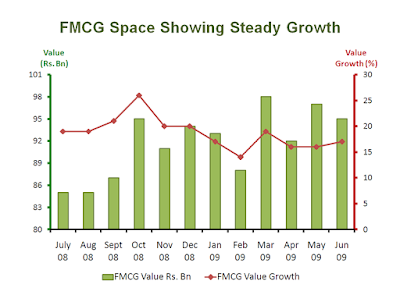
Not all steps will apply to your chart. Use what applies but more importantly treat them as guidelines and do not follow blindly. We did not follow Step 8 above because the chart demanded it. Here is you new chart after the makeover.
If I were presenting this, I would go one step further. There are no data labels and we have two axis. How do you know what is being measured on which axis? One measure we took to solve this problem was in Step 8 where we added Axis Titles (Value Rs. Bn and Value Growth).
What more can you do?
Change the color of primary axis (left) to dark green and secondary axis (right) to reddish brown. Ensure your axis is thick enough to make these colors noticeable. When you read this chart, visual cue will compliment text well. Here is your final chart:
Notice that font colors of Axis Titles have also been color coded. Primary Axis Title is green and the Secondary Axis Title is reddish brown.

Your chart will be read only if it appeals to the eye. You don't need a piece of art. But that does not mean that your chart totally ignores basic design principles. Every presenter is a designer and it's time you stood up and took notice.

Sep 14, 2009

14 Charting Tips: Tip #12 Highlighting What's Important

This is the 12th post in the series, 14 Tips to Present Awesome Charts.

What does it mean to highlight?

To highlight (verb) means to make something more prominent. It is different from the noun highlight which means the most important part. We are concerned with the verb form here.


What do you highlight?

You highlight a data point or a data series or a relation between two data points (or series). Example, highlighting one bar is a data point but highlighting a line graphs made out of 10 data points is a data series.

When do you highlight something important?

By definition, you highlight something that you want to make prominent. It is not already conspicuous (obvious to the eye). Some instances when you highlight are:

i. You highlight to point out the change in values of a variable (a growth in sales over time). By looking at the graph, the growth is obvious but the percentage is not.

ii. You highlight to give a reason for change in values of a variable (a sudden fall in sales, a dip in share prices). The reason is not captured in the graph and hence needs to be separately mentioned.

iii. You highlight to make something stand out. Something that is already there but as part of a crowd. Like your company's sales graph when compared to 9 other companies.

iv. You highlight to bring out the relationship between two variables. You have plotted sales & profit bar graphs but profit percentage is not captured in the graph. You can highlight that. 

Examples illustrating instance 1 & 2: See the Chart #1 in the image below.


This chart from ACC shows sales growth of the company over time. I have cropped out the EBITDA (profits) portion from the chart. They have highlighted (pointed out) 5% which is the change in sales. It is possible that industry was in a bad phase and 5% is something to take consolation from. Never highlight what puts you in a bad light unnecessarily.

Chart #2 has been taken from FMCG major Dabur. They are showing quarterly revenue growth over the last 8 quarters. They are giving a reason (a clarification) that the good growth of 22.1% is not coming majorly from acquisition of another company Fem. The growth is mainly organic (which is a good sign). 

Examples illustrating instances 3 & 4:

Chart #3 is from the website of Reliance Industries. Talking about world's largest refining companies they highlight their own place among 16 other companies by giving their bar a red color. This is a good way to stand out. In the same chart, they have also marked state-owned companies and made them stand out by giving it another shade of blue. Bad job. They should have used another color.

Chart #4 presents the sales and profits of a hypothetical organization. Profit as a percentage of sales is important to know and has not been captured in the graph. To bring out this relationship between sales and profits they add a text; '46% is the 3 year average profitability'.

How do you highlight?

If you have carefully observed you will notice that color and shapes are used to highlight. Merely text is not sufficient. In Chart 3, if the RIL bar was given a gradient, the effect will not be as great. Using color is better and using red even better as it attracts the eye the most.

You can highlight by:

1. Using shapes and colors along with text, and
2. Using animation

Animation is a medium you should use to highlight. In Chart #2, after having presented and discussed the growth rates in sales, the presenter can on mouse click circle the 22% and make the attached text appear. Read more on animation here (Tip #11). 

Highlight & Key Message 

Chart highlight is not the same as key message. While talking about key message we discussed that key message is the point you are trying to prove with your chart (to read about key message click here). Highlighting can be a good way of supporting your key message.

The key message for Dabur in Chart 2 above could be; "We have grown very well over the years purely due to the efforts that have been put by the company. Contrary to popular belief it has not come from acquisitions like Fem in 2009-10." The highlight in this case supports the key message.

How do you highlight important points in your charts? What are the occasions when the need for highlighting arises? Or, you are someone who prefers talking and not highlighting? Share it here. Leave a comment.

Sep 13, 2009

14 Charting Tips: Tip #11 Chart Animation

This is the 11th post in the series, 14 Tips to Present Awesome Charts.

We are now almost at the end of this 14 part series. In the last post I talked about an often neglected part of presenting charts; colors. Today, we will discuss about another area which presenters have underutilized; Chart Animations.

 We will discuss the following:

1. What do we mean by chart animation?
2. When to use animation and why?
3. How to animate a chart?
4. How not to misuse animation?

1. What do we mean by chart animation?

When we talk of chart animation, we do not mean that the entire chart appears with an effect or fades in, etc. We are talking of animating the line graphs or bar graphs of the chart. Animation would make each data point or series of data points come one after the another, with a clear purpose. The purpose is covered in point 2. 

2. When to use animation and why?

In my Feb 24th post this year, I had talked about when to use animation. That applies to any animation and hence I would quote what I had said:

"Animation is a powerful tool. It brings your presentation to life. When slides after slides are static, animation comes in to break the monotony. It draws the attention of the audience and gets your point across very effectively. You should use animation when:

1. You want to draw the audience attention to an important point

2. You want to explain a complicated process

3. You want to share information in a phased manner
"

Point 1 and 3 are applicable when we are animating a chart.  There is also a 4th instance:

4. When you have too much information to present in a chart, it is better to animate and present in a sequence. 

As I have mentioned, the reason you use animation is that it breaks the monotony. Imagine after 10 static slides you suddenly have a good animation on Slide 11. Audience attention increases many fold.

3. How to animate a chart?

We would look at various examples and learn how to animate.

Example 1 (Illustrating Point 1 above): 
You, the CEO of Red Soaps, is presenting at a press conference ahead of your IPO (new share issue to public). Because your soap brand (Red No. 1) is not advertised it is not popular in the masses. Your charts' key message is that your brand is much bigger than the 4 more popular soap brands in the market. How do you draw the attention of the public who are going to give you $1000mn if your presentation impresses them? Well, if you use the easy-to-use framework in my 2nd post, you would choose a bar graph. Here is your chart:
You can present this chart at once and make the point; "You know these big brands. But did you know we are bigger than them?" 

A better approach: Create a story. Animate the five bar graphs (animation effect: wipe from bottom) and ask the audience to guess the turnover of each brand. At the last, when your brand's bar goes past all these popular brands, your audience will get the message loud and clear. They will remember this animation and will also remember the message.
Animation Steps

Step 1: Right click on your chart -> Edit Data ->  Arrange the series in ascending order of sales.

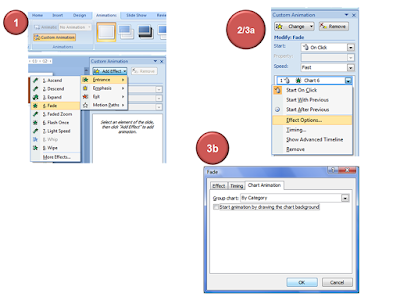
Step 2: Click on the chart to select it -> Animations Tab (in version 2007) -> Custom Animation -> Add Effect -> Entrance -> Wipe

Step 3: In Custom Animation -> Make Direction from Bottom -> Speed Fast -> Start On Click

Step 4: Drop down menu -> Effect Options -> Chart Animation Tab -> Group Chart By Category -> Do not Start animation by drawing the background
 

In slide show mode, the axes and title would be present. Your bar graphs will come one by one mouse click.

Example 2 (Illustrating Point 3 above): 
You are presenting the shareholding pattern of Infosys. You want to talk about each of the 6 entities which own shares in the company. You plan to spend a minute each on every group of investor. You thus want to show this information in a phased manner.


If you put up the entire pie at one go, then every member of the audience is free to look at any component. You lose control. To take the entire audience along and have all of them paying attention to what you want them to listen, you need to animate this chart. Animate it to present one portion at a time. 

Animation Steps

Step 1: Select the chart -> Animations Tab -> Custom Animation -> Add Effect -> Fade

Step 2: In Custom Animation -> Speed Fast -> Start On Click

Step 3: Drop down menu -> Effect Options -> Chart Animation Tab -> Group Chart By Category -> Do not Start animation by drawing the background
 
Now in slide show mode, your chart will come like this:


Example 3 (Illustrating Point 4): 
When you have too much information to present in a chart and together it looks cluttered, you should animate and present them one at a time. Imaging you are tracking the share prices of various Pharma companies from Jan to May '09. This is how the chart looks like:


I have just shown 3, you might have 5 or 10! Instead of putting all of them and making a mess present each line graph one by one. So at the first click, line 1 comes as 'wipe left' and you can talk about it. Then line 2 can come (you can make line 1 disappear as well or keep it). This way you can present the same information in a much more understandable manner. The method to animate these lines is the same as already described above.  

4. How to not misuse animation? 

Animation is a 'special' effect which works when used very few times. Then only it breaks the monotony and draws audience attention. Do not do the following:

i. Do not animate every possible chart in your presentation

ii. Do not use wrong effects (line graph coming as 'wipe from bottom', horizontal bar coming as 'wipe from left')

iii. Do not use weird effects. Use simple effects like fade, zoom, wipe, ascend, descend, expand, compress, etc.

iv. Do not use more than 1 type of effect in a chart. Every sub-part of pie should come as fade in. Do not make one part zoom in, another zoom out and the third fade.

If used prudently, animation can become the secret weapon that will give your presentation an undue advantage over others.

Sep 12, 2009

14 Charting Tips: Tip #10 Coloring Your Chart

This is the 10th post in the series, 14 Tips to Present Awesome Charts. 
"Life is polychromatic. Do not live it in monochrome."
Your chart is a lot like your life. So, stop being a bore and make your charts
interesting by coloring them well.


What is the role of color in a Chart?


While I am talking about chart colors, I can see many eyebrows raising. "We make formal presentations and all this coloring has no place in our company. Let's talk data."
This post is not about how to make your chart colorful and get noticed. This post is about how to balance the colors on a slide so that chart colors become invisible.

Yes, the way I look at colors is:


"Color is that ingredient of
your dish (chart) which does not have a taste of its own. It enhances the taste of the dish without getting noticed. If the color of your chart is getting noticed, you have failed."


The role of color is thus two fold:
1. It has to make the job of audience easy to read the chart
2. It should not distract and draw attention towards itself

Example 1: Look at this chart from the website of Emami. A FMCG major which is also one of the most aggressive marketers in India.

This chart is a disaster. Too much clutter.
How many colors are there in a chart?


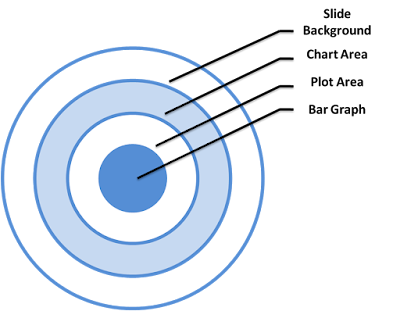
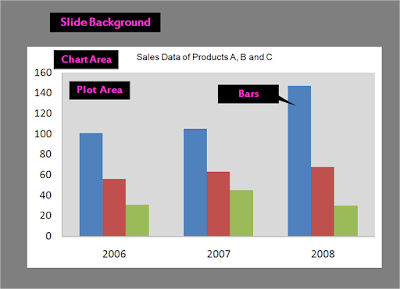
To color a chart you need to take care of many things. It is not only the color of the bar or line graph. You need to consider the following four:

1. Color of the bar/line graph
2. Color of the plot area
3. Color of the chart area, and
4. Color of the slide.

Look at the image below:


When I talk about chart color I am talking about the color of these 4 elements (slide, plot area, chart area and bar/line). The color of your bar cannot be seen in isolation from the colors around it.

When you create a chart you must ensure there is harmony and balance between color of these 4 elements. The question I would like you to think about is where do you start? Which color should you pick first?


It is the slide color which comes first. The order is SCPB (S-Slide, C-Chart, P-Plot, B/L-Bar/Line). It is the same order which they appear in the slide above. You do not decide the slide color after making your chart. The slide color (which is part of the template) is decided first. Charts come later. You might have a fixed template or you might like to use your corporate colors in your entire presentation. Like Arcelor Mittal's annual report where they have all backgrounds in orange and grey.
Step 1: Choosing the slide background color
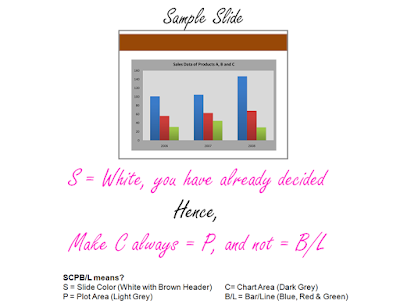
Whenever you make a presentation, go for a white background. If your presen
tation has a lot of charts, white is the best background for you. Even if your presentation does not have charts, white is still the best slide background color.

Example 2: A white background looks better

White is more comfortable on the eye and allows a lot more flexibility in choice of colors for the other elements of the chart. Black on the other hand is heavy on the eye.


Step 2: Choosing the colors of chart area & plot area

After having decided the slide background
color, we now need to decide the colors of C, P and B/L. Use this rule always:

All I am saying is, merge the chart into the slide completely. So that there are only two parameters left to color. One the background (Slide=Chart area=Plot area) and second the Bar/Line graphs. You might choose a black background or a white background. But ensure that you merge S, C and P so that the chart is easy on the eye.

Step 3: Choosing the color of Bar/Line Graphs


After merging the slide area with the chart area and the plot area now its the turn of the bar graphs/line graphs. MS PowerPoint gives you many options. It is a two stage process.
First, choose from the 5 options on the left. To change the color of the bar select it by clicking on it and rigth click for 'Format Data Point'. You can now get all these types of options. Which one do you use normally? The default is always solid color.
I would advice you to do the following:

1. Always go for solid color bars

2. If you are plotting only one thing (sales over years) then all bars should be of the same solid color. If however, you are plotting 2 things (sales and profits over years) so there are 2 bars. Go for different color bars for sales & profits. You can also choose a shade of the same color (dark and light blue).

3. If you are plotting more than 2 things, then never choose shades of the same color.


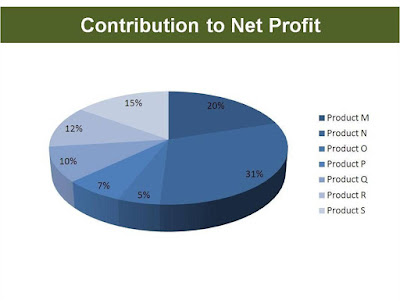
Example 3: Hypothetical pie chart (inspired from a real life chart). Let us come out of bar graphs and see this pie chart which tries to show 7 things.
If color is the ingredient of your recipe then this pie chart is a recipe for disaster. A simple solution for this is to use labels (Product M, N) besides the percentage. Making the chart multicolor will not solve this problem.

To Summarize, remember these guidelines while you use color:

1. The fewer the number of colors you use, the better your chart becomes.


2. Do n
ot do anything that draws attention of your audience towards the color of the chart.
3. Stay away from gradients, flashy colors and using images in your bars. They reduce the visibility of your chart.


Keep watching presentations and observe how people use colors in charts. Remember, that you cannot ignore it!

Did I leave any doubt in your mind? or do you disagree to something? Leave a comment.


--
Disclaimer: Charts used above are purely for educational purposes. It is not meant to comment on the working of any organization. They would be removed in case anyone has any objection.

Sep 11, 2009

14 Charting Tips: Tip #9 Source of Data

This is the 9th post in the series, 14 Tips to Present Awesome Charts.

Your chart is made from raw data. But this raw data is not a fiction of your imagination. It has a source. A source from where you culled out the data for analysis and representation. We will today discuss about this most ignored element of a chart; source of data.


We will cover the following questions:

1. Why you need to worry about the source?

2. When should you mention the source and when you need not?

3. How and where do you mention the source of data in your chart?

1. Why you need to worry about the source?


Imaging this situation: You are in-charge of new product launches in your company. You have studied the fairness soap market for men in India and in your presentation to the CEO you are
recommending to launch a new soap brand. In the process of research you would have come across lots of data. When you present it, your CEO might ask; "Where did you get this data from?" All that he is asking for is; tell me the source of data.


For the audience to accept your charts' key message (the point you are trying to make), they need to know if the chart is credible. They might not ask for the source always, but having it on the chart enhances the credibility of your argument.

2. When should you mention the source and when you should not?


Though every chart has a source, you need not mention it all the time. It is required when there is a need to boost credibility. Talking about credibility, there are two situations you need to consider:


i. Internal Credibility - Source of data is optional

ii. External Credibility - Source of data is necessary


When you are presenting something from your area of expertise (domain), you do not need to compulsorily mention a source. The credibility comes from you (the presenter) and your audience knows about your expertise. They trust you. But, it is possible that you are presenting something outside your domain. In which case, the audience would like to know the source of your data.

Remember, the taller your claim, the more credibility you require to support it. You can't get away by simply making bold claims and recommendations and not backing it up.
Let us look at a few examples:

Example 1: Steel behemoth Arcelor Mittal's Annual Report, 2008

This chart gives you data on world's crude steel production. Now a shareholder might ask; "Why should I trust this data? You may be the largest steel company in the world, so what?" To answer this doubt which many people will (subconsciously) have, they have mentioned the source.

Example 2: FMCG major Dabur's Investor Presentation, Aug 2009

Here, the FMCG company is talking about how the Government of India is planning to increase spends in Rural India. This will lead to a demand increase for FMCG and hence Dabur will benefit. The investor might ask, "What expertise do you have to talk about government spending?" That is why they mention the source of data.


Example 3: A chart from the car maker Maruti Suzuki's presentation

In this chart the company is sharing its financial results from 2002-03 to 2008-09. They have not mentioned any data source. It is internal data and they are the best people to know that. There is enough internal credibility and thus need for a source is eliminated.

3. How and where to mention the source?


If you notice the charts above, the source has been mentioned below the chart. I would advise you to follow the same. Instead of hiding it somewhere is minuscule size font, mention it just below the chart in a font size that is easy to read.

But how do write the source? In how much detail?
Ask yourself this question and you will know in how much detail should you write the source: "If your audience wanted to check your data with the source, can they do that easily." If no, then re-write the source to make it easier to verify. Let us see example 4.

Example 4: A presentation by Doug Baillie in 2007, the CEO of Hindustan Unilever available on their website.

Notice that the claim is; HUL is India's biggest FMCG company. A tall claim but everyone in the FMCG business knows it already. Moreover, it is coming from a credible source, the CEO himself. Yet the source is mentioned. To keep the skeptics quiet. The source is; for reach data 'Hansa Research's Guide to Indian Markets 2006'. If you wish to check the claim, you know where to go and ask for it.

Summary of today's post:

1.You need to write the source to add an extra dose of credibility to your claim.

2. The taller the claim you make, the more the need for the source. If you are using words like best, most, largest, be ready to back it up with the source.

3. When you are presenting data from within your domain (area of expertise), do not mention the source. When you are going out of your domain always mention the source.

4. Mention the source below the chart in legible font size.

5. Remember, you trust yourself more than others trust you. You are honest does not mean you will not furnish the data source.

Sep 10, 2009

14 Charting Tips: Tip #8 Chart Axis

This is the 8th post in the series, 14 Tips to Present Awesome Charts.

Today we will talk about chart axis. To be specific, we will discuss the following:
1. What is an axis?

2. What should you know about an axis?

3. What more can you do with an axis?

4. When and how should you use secondary axis?


1. What is an axis?

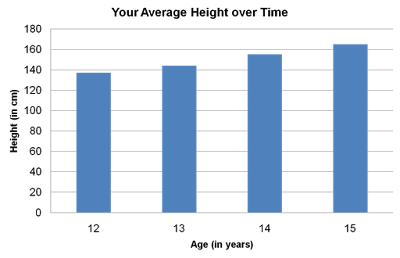
An axis in a chart or graph is the line along which we measure our variables. It is nothing but a scale (or a ruler). Go back to your class 6-7 where you read about Y-axis and X-axis. In the following chart, we are measuring your height up the Y-axis and your age along the X-axis.


Example 1 Your height over time
The first data point; at age 12 your height is just under 140cms, at age 13 it is just above 140. The axis tells you that age and height are being measured. Age is being measured along x-axis (horizontal axis) in years. Height is being measured up the y-axis (vertical axis) in cm. The axis also lets you read the measurements. If you need more accuracy, you need to label the data.
2. What should you know about an axis?

First, you should know what is the purpose of an axis. To be able to use something, you should
know what it can and cannot do. An axis tells you what is being measured and also lets you read the values (approximately). As an audience, you should always check out the axis before looking at the bar or line graph.

Second, because the axis tells you how to read the chart, you have to label the axis. The way I have done it in the chart above. Label the axis by doing two things:


1. State what is being measured, and

2. Mention the units of measurement.


This is however theory. Practically you should only ensure that these two pieces of informatio
n are there in a chart. But I advise you not to put this information always in your axis. Look at these two examples:

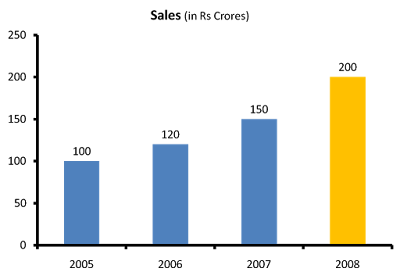
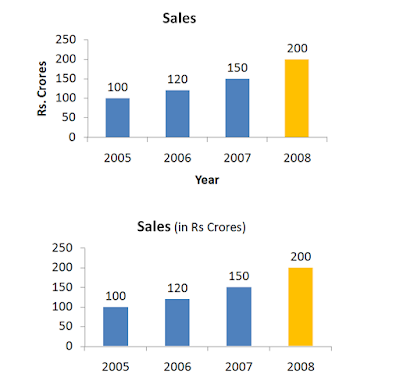
Example 2 Sales of Company X from 2005 to 2008
The chart on top follows the theory but the chart on the bottom does not. If you are presenting, which one of these should you prefer? My answer: The one at the bottom. The lesser you write on the chart, the more space you save. And all this happens without loss of information. You do not need to mention Rs. crore and year with the axis. Treat space on a chart as precious real estate.
3. What more can you do with the axis?

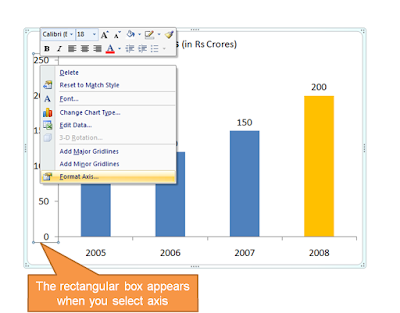
You can actually do a lot of stuff with your axis. To find out what all, left click to select the axis an
d then right click and choose Format Axis.
There are many options in front of you like Axis Options, Number, Fill, Line Color, Line Style. We will understand the main ones with help of an example:
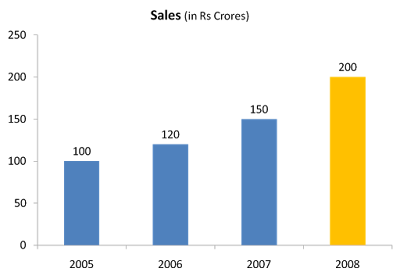
Example 3 Sales of Company X from 2005 to 2008


3a. Line Color & Styles
Choose vertical y-axis -> Format Axis -> Line Color. Solid Black. Then Line Style -> Width 4

Again, choose horizontal x-axis -> Format Axis -> Line Color. Solid Black. Line Style -> Width 4. You chart now looks better than before.


3b. Axis Options
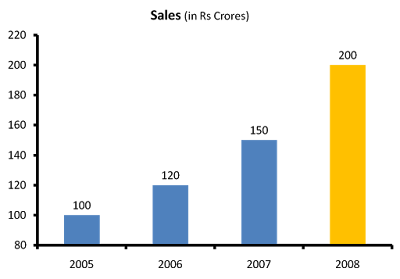
Choose the vertical y-axis -> Format Axis -> Axis Options -> Change the 'Minimum' from Auto to Fixed and enter 80. See what happens.


The y-axis now starts counting from 80. The growth in sales now looks far better than it looked when the axis started from zero. Which one is better? Companies in their annual reports do play this trick very often. See this example from Hindustan Unilever's presentation:
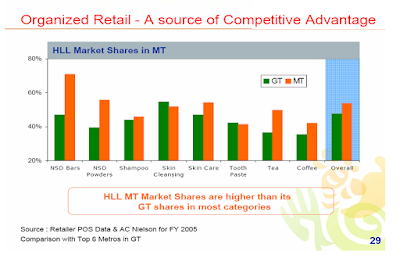

Is it wrong? I would say, No. No in the case of this particular chart. Because of two reasons:
i. The objective of the chart is to show that company's market share in Modern Trade (MT) is more than General Trade (GT). If the axis starts at zero, the difference between bars will not be so clear. Starting at 20 makes the difference more pronounced.


ii. The company is not cheating here. They have labeled the axis and one can see it starts fro
m 20.

How can it be misused?

You can misuse it by starting from non-zero and not telling your audience about it. Many
presenters delete the axis, and label their bar graphs. They keep the audience in the dark.

What should you do?

Do not delete your axis. Tell your audience in case your axis does not start from zero. What HUL should have done is to add a * and mention that the scale starts from 20.


4. When and how should you use secondary axis?

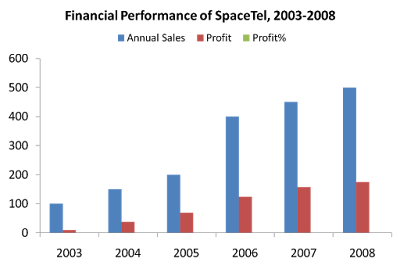
I had given you a problem in my second post. I will restate the problem now and solve it also. This is the raw data you have for a fictitious company SpaceTel
.

Example 4 Financial Highlights of SpaceTel

How will you make the chart?

Using the table (framework) we made in the
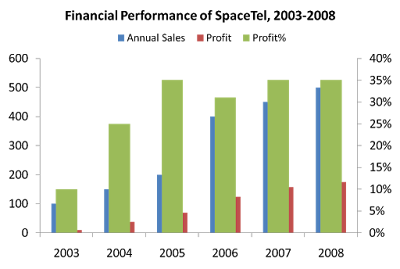
second post on How to choose a chart, you decide to use bar chart. Here is your chart.


What is wrong?
The software looks at all the values and tries to fix a scale (axis) which includes the maximum value of 500. Hence, it has taken the scale up to 600. By doing this, the profit percentage data which is maximum 35% (=0.35) becomes invisible. How do you solve this problem?


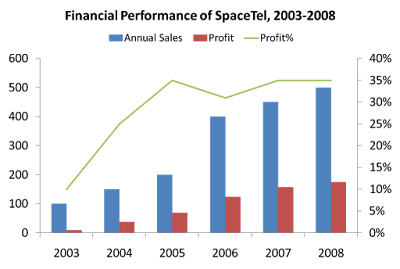
You need a different axis in the same chart. That 'other' axis is called 'secondary axis'. On this we measure the profit percentage.


Adding a secondary axis

Step-1 Choose the data series 'profit percentage' by clicking next to the profit bar in red.

Step-2 Right click -> Format Data Series
(MS PowerPoint 2007)
Step-3 Under Series Options -> Choose Secondary Axis -> Close
Are you in deeper trouble now?
No. Click on the data series again (one click on any green bar will select all bars). Right click and select 'Change Series Chart Type'. Choose a Line Graph. Click Ok. Your chart is ready.
You can add data labels and do what ever else you need. Don't forget to add your key message as well.

To quickly summarize what we learned today about axis:

1. Axis is a scale which tells you what is being measured and its unit of measurement.

2. These two pieces of information have to be present in the chart, though they need not be labeled with the axis. You can mention it with the chart title.

3. Your axis need not start from zero. In case it does not, share this with the audience.

4. When you are measuring variables (like sales, profits) whose values are different from each other or the gap between maximum and minimum value is too big, then add a secondary axis.