Recap of 14 Tips to Present Awesome Charts
14 Tips to Present Awesome Charts is a special series which shares 14 practical tips on how to present your charts better.
 Why study the 14 Tips?
You can crunch data well and make a chart. At the time of presenting you still falter because you have overlooked the bigger picture (why are you presenting the chart? what is your key message?). Your chart looks complicated and busy because you have allocated no time to chart design. To understand what goes behind making a great chart, read these tips. Every tip contains multiple examples from real life. Here are the links to the 14 posts:
1. Why do you need a chart?
You should not work with the principle that 'where there is raw data there is a chart'. This post helps you find out when you need a chart and when you don't.
2. How to choose the right chart type?
Most of the time you have multiple chart types to choose from. Line or bar, bar or pie. This post deep dives on how to choose a right chart type with an easy to use framework. A must read post!
3. Chart Title
Talks about the purpose of a title and how to write the perfect chart title.
4. Key Message
The reason you are presenting a chart is to prove a point. Your key message then becomes the most important element of your chart. This post explains how to present the key message.
5. Data Points
In order to prove your point, you don't need to create a chart with every piece of raw data available. This post provides tips on how to decide on the number of data points and the cautions you need to take to present them.
6. Data Labels
If you are wondering why am I talking about data labels, this post is for you. Often ignored aspect of a chart is data label. Find out how and when to label your data points and more.
7. Legend
If data label is the most ignored element of a chart, legend is the most abused. This post will tell you everything you need to know about legends; its need, its position and its usage.
8. Chart Axis
Enhance the understanding of your chart by mastering chart axis. This post also contains a step by step guide on when and how to use secondary axis.
9. Source of Data
Add a booster dose of credibility to your chart by mentioning the source. Learn about when a source is needed and how to write one.
10. Chart Colors
Stop being a bore and understand the importance of colors in your chart. No, I do not encourage you to fill your charts with every possible color. Discover how you can really enhance audience understanding by a right use of colors.
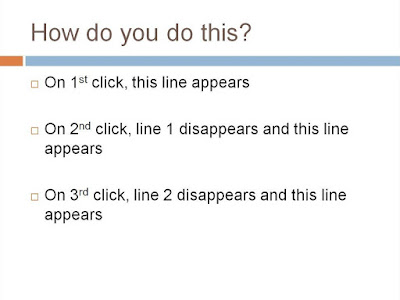
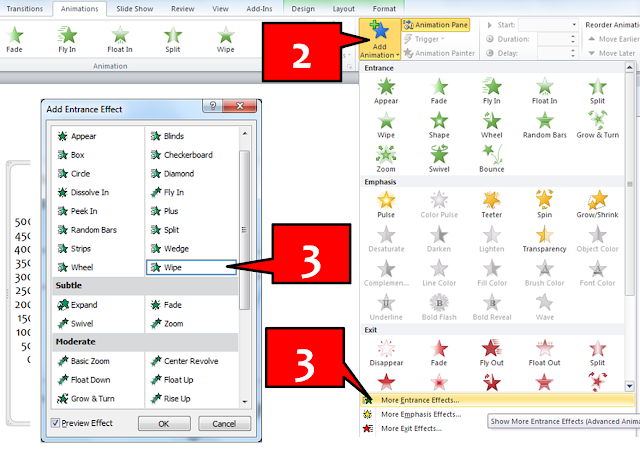
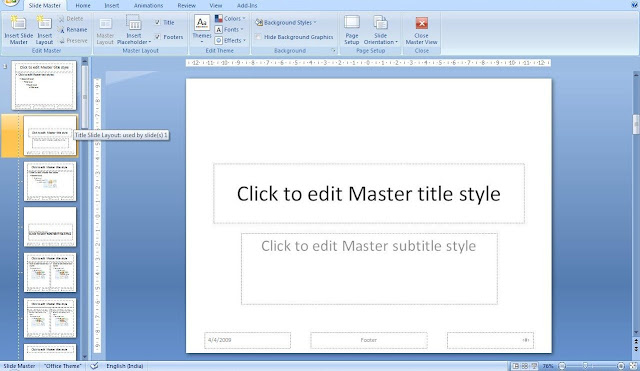
11. Chart Animation
The secret weapon with which you can draw complete audience attention and drive home your point with style and ease. This post tells you when to use animation and how.
12. Highlighting
Not everything in your chart is important. Understand what to highlight, when to highlight and how.
13. Chart Aesthetics
Enhance the aesthetic appeal of your chart in 10 easy steps. A must read post!
14. Summary
This series is based on the philosophy that presenting a chart involves learning about two things; chart core and chart design. This post captures the essence of the entire series and gives you the bigger picture of how to present charts. It also contains tips on how to keep developing your charting skills.
Go ahead and use the series. Feel free to agree / disagree with what has been said. Apply the tips in real life and share the results. Share these tips with friends and colleagues.
I am in the process of creating a free e-book on these 14 tips. Watch this space for more.
 Why study the 14 Tips?
You can crunch data well and make a chart. At the time of presenting you still falter because you have overlooked the bigger picture (why are you presenting the chart? what is your key message?). Your chart looks complicated and busy because you have allocated no time to chart design. To understand what goes behind making a great chart, read these tips. Every tip contains multiple examples from real life. Here are the links to the 14 posts:
1. Why do you need a chart?
You should not work with the principle that 'where there is raw data there is a chart'. This post helps you find out when you need a chart and when you don't.
2. How to choose the right chart type?
Most of the time you have multiple chart types to choose from. Line or bar, bar or pie. This post deep dives on how to choose a right chart type with an easy to use framework. A must read post!
3. Chart Title
Talks about the purpose of a title and how to write the perfect chart title.
4. Key Message
The reason you are presenting a chart is to prove a point. Your key message then becomes the most important element of your chart. This post explains how to present the key message.
5. Data Points
In order to prove your point, you don't need to create a chart with every piece of raw data available. This post provides tips on how to decide on the number of data points and the cautions you need to take to present them.
6. Data Labels
If you are wondering why am I talking about data labels, this post is for you. Often ignored aspect of a chart is data label. Find out how and when to label your data points and more.
7. Legend
If data label is the most ignored element of a chart, legend is the most abused. This post will tell you everything you need to know about legends; its need, its position and its usage.
8. Chart Axis
Enhance the understanding of your chart by mastering chart axis. This post also contains a step by step guide on when and how to use secondary axis.
9. Source of Data
Add a booster dose of credibility to your chart by mentioning the source. Learn about when a source is needed and how to write one.
10. Chart Colors
Stop being a bore and understand the importance of colors in your chart. No, I do not encourage you to fill your charts with every possible color. Discover how you can really enhance audience understanding by a right use of colors.
11. Chart Animation
The secret weapon with which you can draw complete audience attention and drive home your point with style and ease. This post tells you when to use animation and how.
12. Highlighting
Not everything in your chart is important. Understand what to highlight, when to highlight and how.
13. Chart Aesthetics
Enhance the aesthetic appeal of your chart in 10 easy steps. A must read post!
14. Summary
This series is based on the philosophy that presenting a chart involves learning about two things; chart core and chart design. This post captures the essence of the entire series and gives you the bigger picture of how to present charts. It also contains tips on how to keep developing your charting skills.
Go ahead and use the series. Feel free to agree / disagree with what has been said. Apply the tips in real life and share the results. Share these tips with friends and colleagues.
I am in the process of creating a free e-book on these 14 tips. Watch this space for more.
Comments
Post a Comment